
“Is Market Concentration a Long-Term Risk?”
There’s a lot of noise about the fact that today’s biggest companies make up “too much” of the S&P 500 index. As of July 31, the market cap of the ten largest companies made up about 39% of the index's total market cap[1]. That’s a big number, no doubt.
Of course, this is being peddled as a significant risk, just as it has been for quite some time now. To this point, at least, it hasn’t been the risk that’s been advertised, except for those who chose to underweight these dominant companies due to fear of their comparative decline[2].
In any case, high levels of market concentration are nothing new. In the 1960s and 70s, the Nifty-Fifty dominated portfolios, with the top 10 stocks making up about 30% of the index[3]. In 2000, tech and telecom companies pushed the top 10 to exceed 20% of the index[3]. Both concentrations were obviously lower than they are today, but they were both top-heavy periods, historically speaking.
It's important to note that none of the companies from the 60s or 70s remain in the top 10 today. And just two from 2000 make today’s list—Microsoft and Walmart[3+4].
This being the case, with all the rotation at the top, you might expect that long-term returns following those instances would have suffered and been considerably lower than historical averages. Not so much.
From 1965 to today, the market’s real (above inflation) return has averaged about 6% per year. Since 2000? About 5% per year. Compare those to the long-term average over the last century of about 7%, and you’ll see that our experiences since those times are roughly in line with history[5]. Most critically, all returns were well above inflation!
To be fair, there were rough periods of volatility that followed these peak concentration events, but the long-term returns show that market concentration posed little risk for long-term investors like us[6].
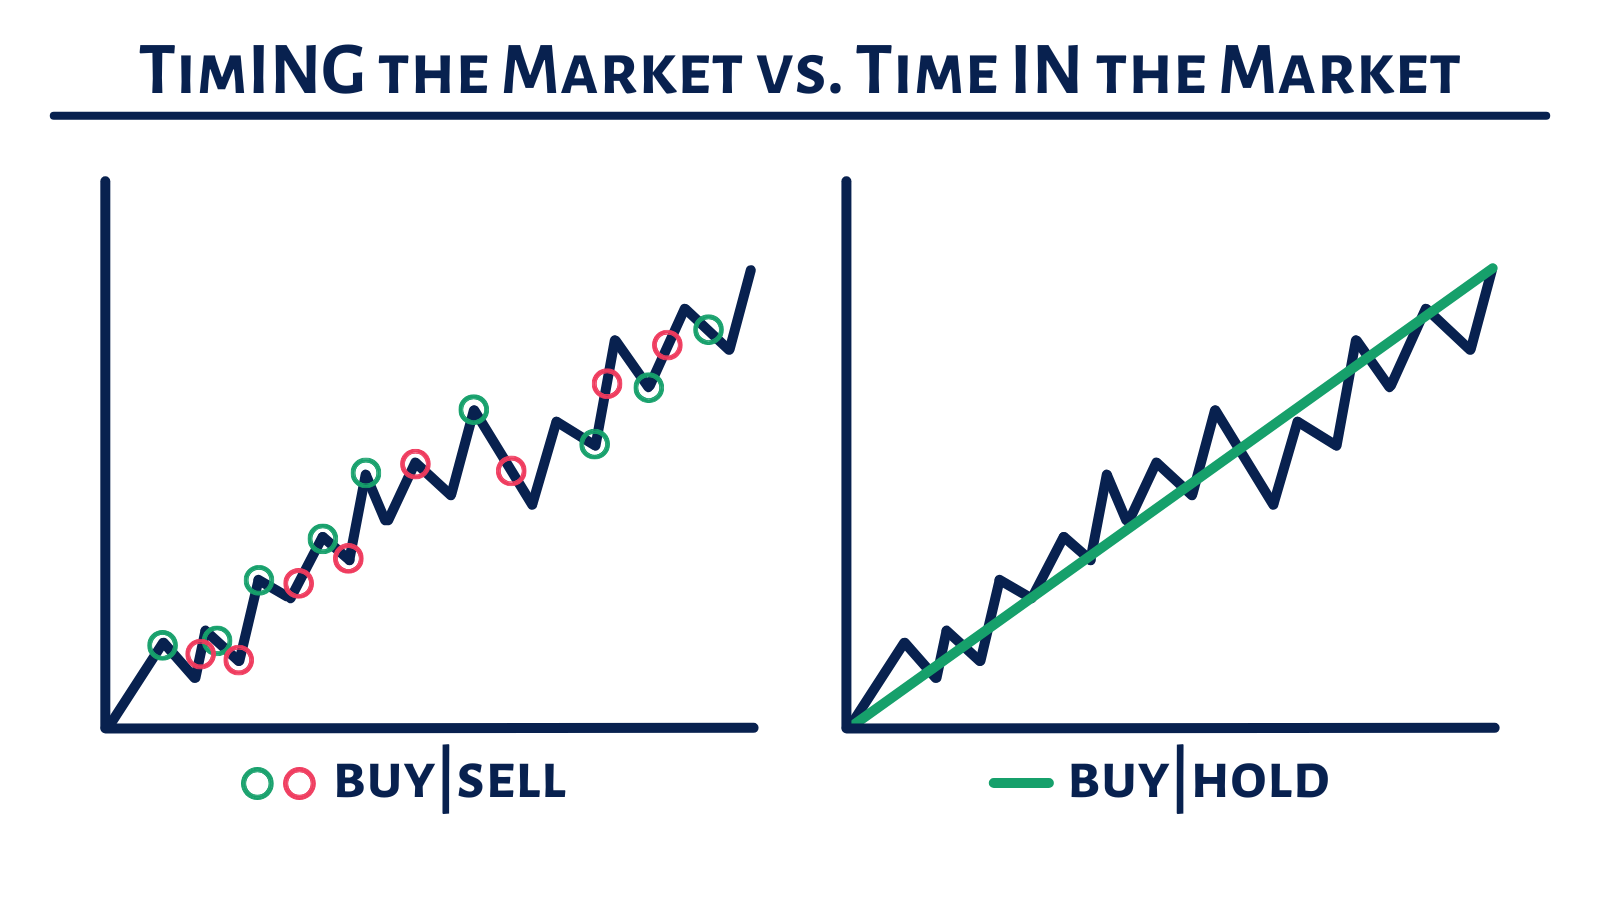
As alluring as it may seem to try avoiding any volatility that may be ahead, the only way I know to ensure we capture all the upside is, not surprisingly, to endure all the volatility along the way. It’s why we always say that time IN the market—not timING the market—is what matters most when investing toward your long-term goals.
Beyond this historical perspective, I think it’s fair to say that market concentration isn’t (generally) a sign that something is broken, but rather a reflection of what’s working.
As consumer preferences change, industries inevitably rise and fall, and the market naturally reallocates capital toward the most productive and profitable companies of the moment. This makes sense, but let’s look at how this has played out recently.
Today’s top 10 companies, which make up the aforementioned 39% of the index, account for 32% of the index’s total earnings[1]. This means that almost a full-third of all earnings is generated by just 2% of the companies. The sheer size, scale, and profitability of these companies is staggering.
With that fact in mind, are we to believe that this market concentration is a result of a market that is broken, or one that is functioning properly? Should we expect these companies to deteriorate overnight with that kind of dominance? It seems unlikely, but anything is possible.
Whether that happens or not, we can expect that today’s giants will eventually stumble. They’re certainly not invincible, but the point I want to make today is that the growing concern that this concentration is some kind of unprecedented danger ignores history—and economics.
I believe the big risk at all times, but especially during periods like this, is thinking that you (or anyone else, for that matter) can forecast this rotation and profit from the timing.
Of course, I believe the prudent approach is to continue being a permanent owner of our market-like diversified portfolios, which inevitably includes these profitable giants. This defaults into letting our winners ride, the laggards fall, and allowing time to do the heavy lifting. Just as it always has.
[1] J.P. Morgan Guide to the Markets – Slide 8
[2] Vanguard
[3] For Top Companies by Market Cap: Research Affiliates – See Chart on Page 3; For Concentration Levels: Morgan Stanley – See Chart on Page 3.
[4] Companies by Market Cap: As of 8.6.2025, Microsoft is #2 and Walmart is #10.
[5] Political Calculations [1965.01-2025.07; 2000.01-2025.07; 1926.01-2025.07]
[6] We plan for extended periods of volatility by owning other low-volatility assets to help provide for near-term lump sum and income needs. For those in the accumulation phase of life, the periods of volatility that followed these concentration events were opportunities to buy shares at comparatively discounted prices.
S&P: 6,386
Disclaimer: The views and opinions expressed are made as of the date of publication and are subject to change over time. The content of this website is for informational or educational purposes only. Website content is not intended as individualized investment advice, or as tax, accounting, or legal advice. It is not intended to be a recommendation or endorsement to buy or sell the specific investment. This information should not be relied upon as the sole factor in an investment-making decision. Website users are encouraged to consult with professional financial, accounting, tax, or legal advisers to address their specific needs and circumstances.